Great sportswear, great operations.
Hastko is taking women’s sportswear by storm. Great founders, great team, now powered by great tech. We built them three apps on one source of truth: Retailer ATS for partners, S&OP for planners and Analytics for the whole team.
- Client
- Hastko, France
- Industry
- Women's sportswear and underwear
- What we built
- Retailer ATS, S&OP, Analytics
- Data
- 8 sources, one warehouse
- Used by
- Founders, planners, marketing and retail partners
The problems we solved
(THE PROBLEM)
(WHAT WE BUILT)
- [01]
Retail partners asked for stock by email, and waited for the answer.
Retailer ATS shows partners what is free to sell, the next inbound date and RRP in euros, kroner and kronor, in their own market.
- [02]
Every team had its own numbers.
Eight sources land in one warehouse and every figure is defined once. Exchanges, replacements and gifted orders stay out of sales.
- [03]
Best sellers sold out, leaving opportunity for more growth.
A stock roll-forward per size and colour with cover targets. Buys are suggested at the minimum order before stock runs out.
- [04]
Purchase orders lived in spreadsheets and email threads.
One PO book with production status, split deliveries and inbound dates that flow straight to partners.
- [05]
Ad spend and stock were read in different tools.
Analytics puts Meta and Google Ads next to each product's sales and weeks of cover.
- [06]
The weekly S&OP meeting took long to prepare.
The Meeting page builds itself: pacing, projections and stock risk, with an AI summary on every chart.
The work we have done with Telemyr over the last few months has changed how we run Hastko. Our team and our retail partners share the same numbers every day, we buy with confidence, and we have more time for product and community. We couldn’t be happier.
Three apps, one sign-in.
Each app is built for the people who use it every day. A switcher in the dock moves between them, and everyone sees the same numbers.
*Figures on mockups are dummy data for demo purposes
Retailer ATS
*Figures on mockups are dummy data for demo purposes
Best sellers by market
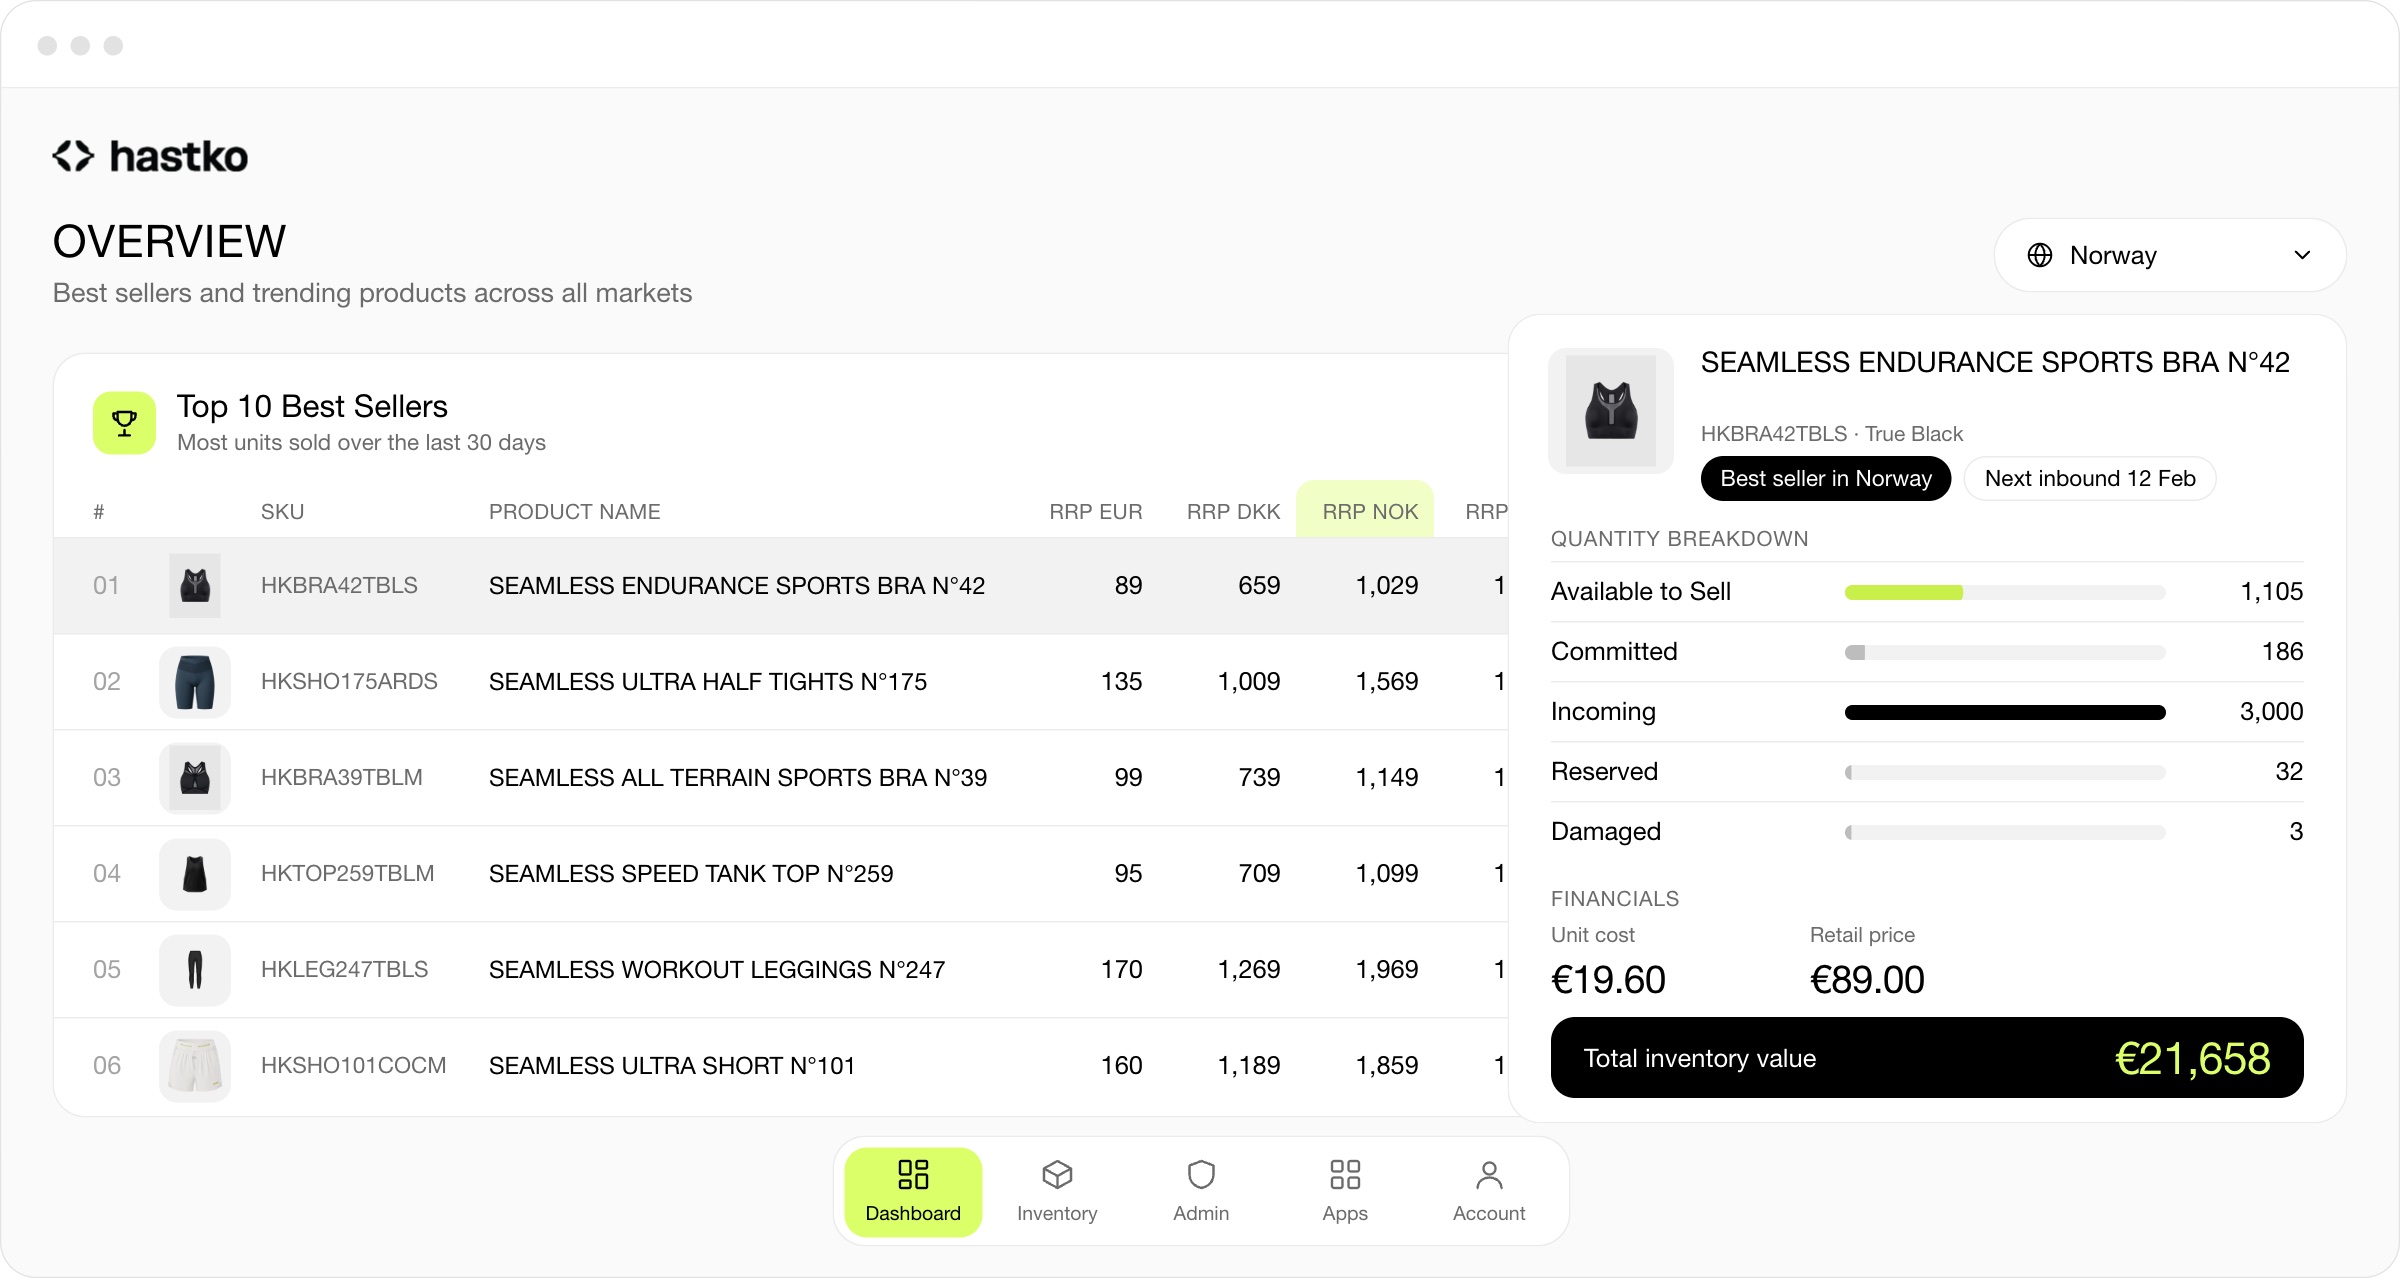
Top 10 over 30 days and Trending today, for all markets or one country.
Free to sell
Available quantity with the next inbound date and expected quantity from the PO book.
The prices partners use
RRP in EUR, DKK, NOK and SEK on every product, with an Excel export.
Product detail
Available, committed, incoming, reserved and damaged stock, with cost, price, margin and inventory value.
Access per person
Admins invite viewers and choose which apps each person can open.
One sign-in
The same account opens S&OP and Analytics for the Hastko team.
S&OP
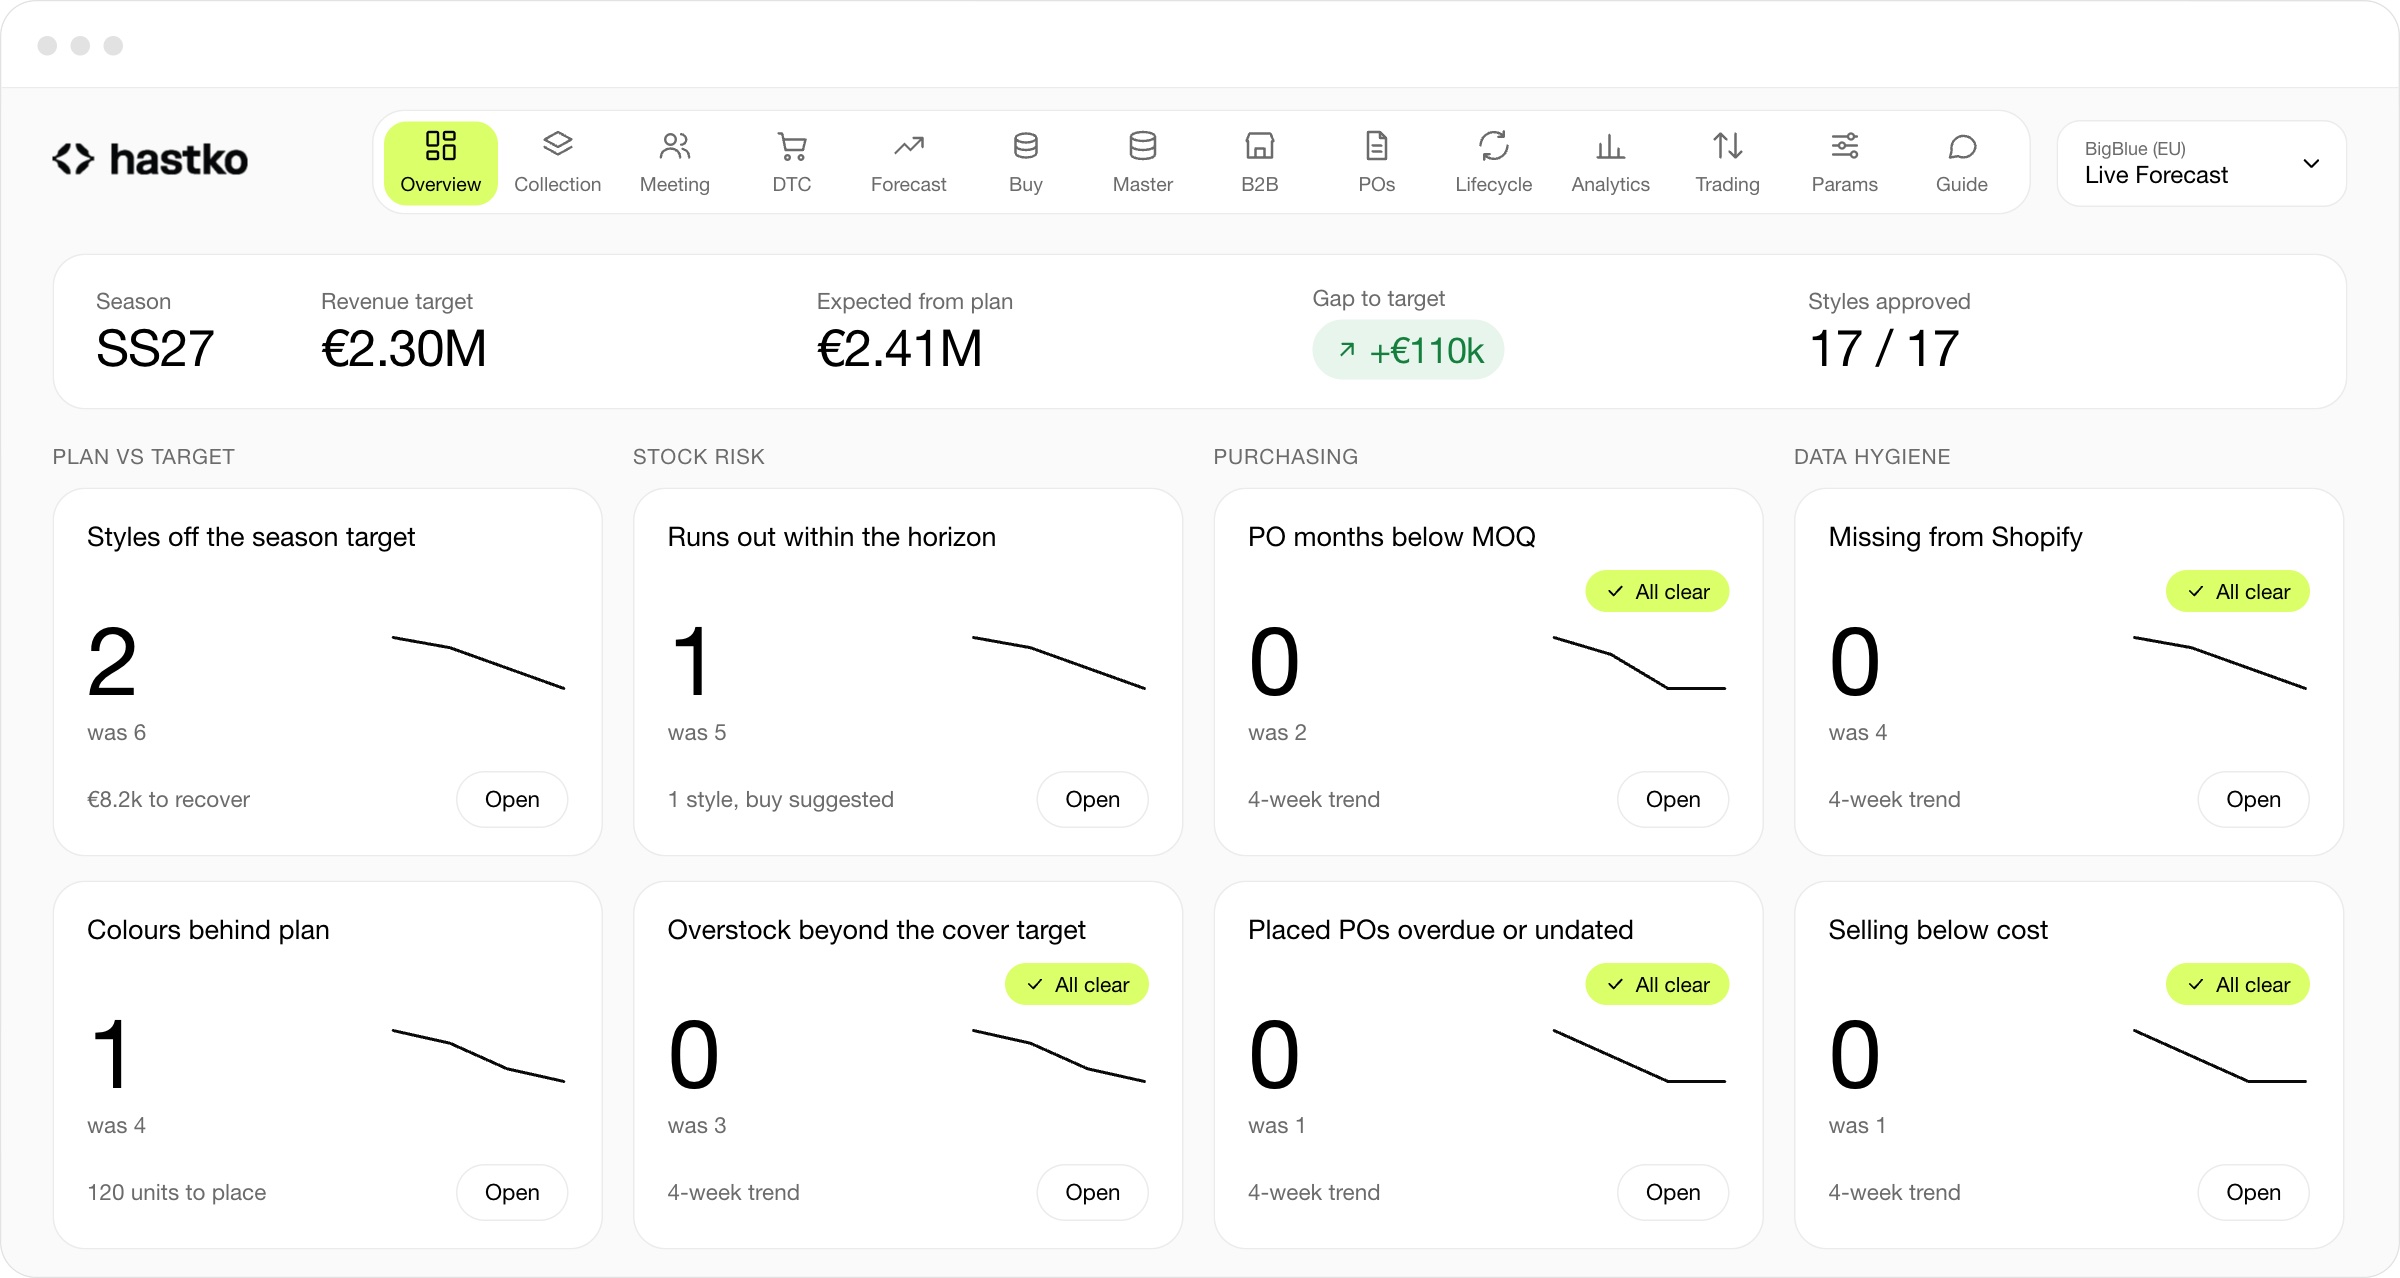
*Figures on mockups are dummy data for demo purposes
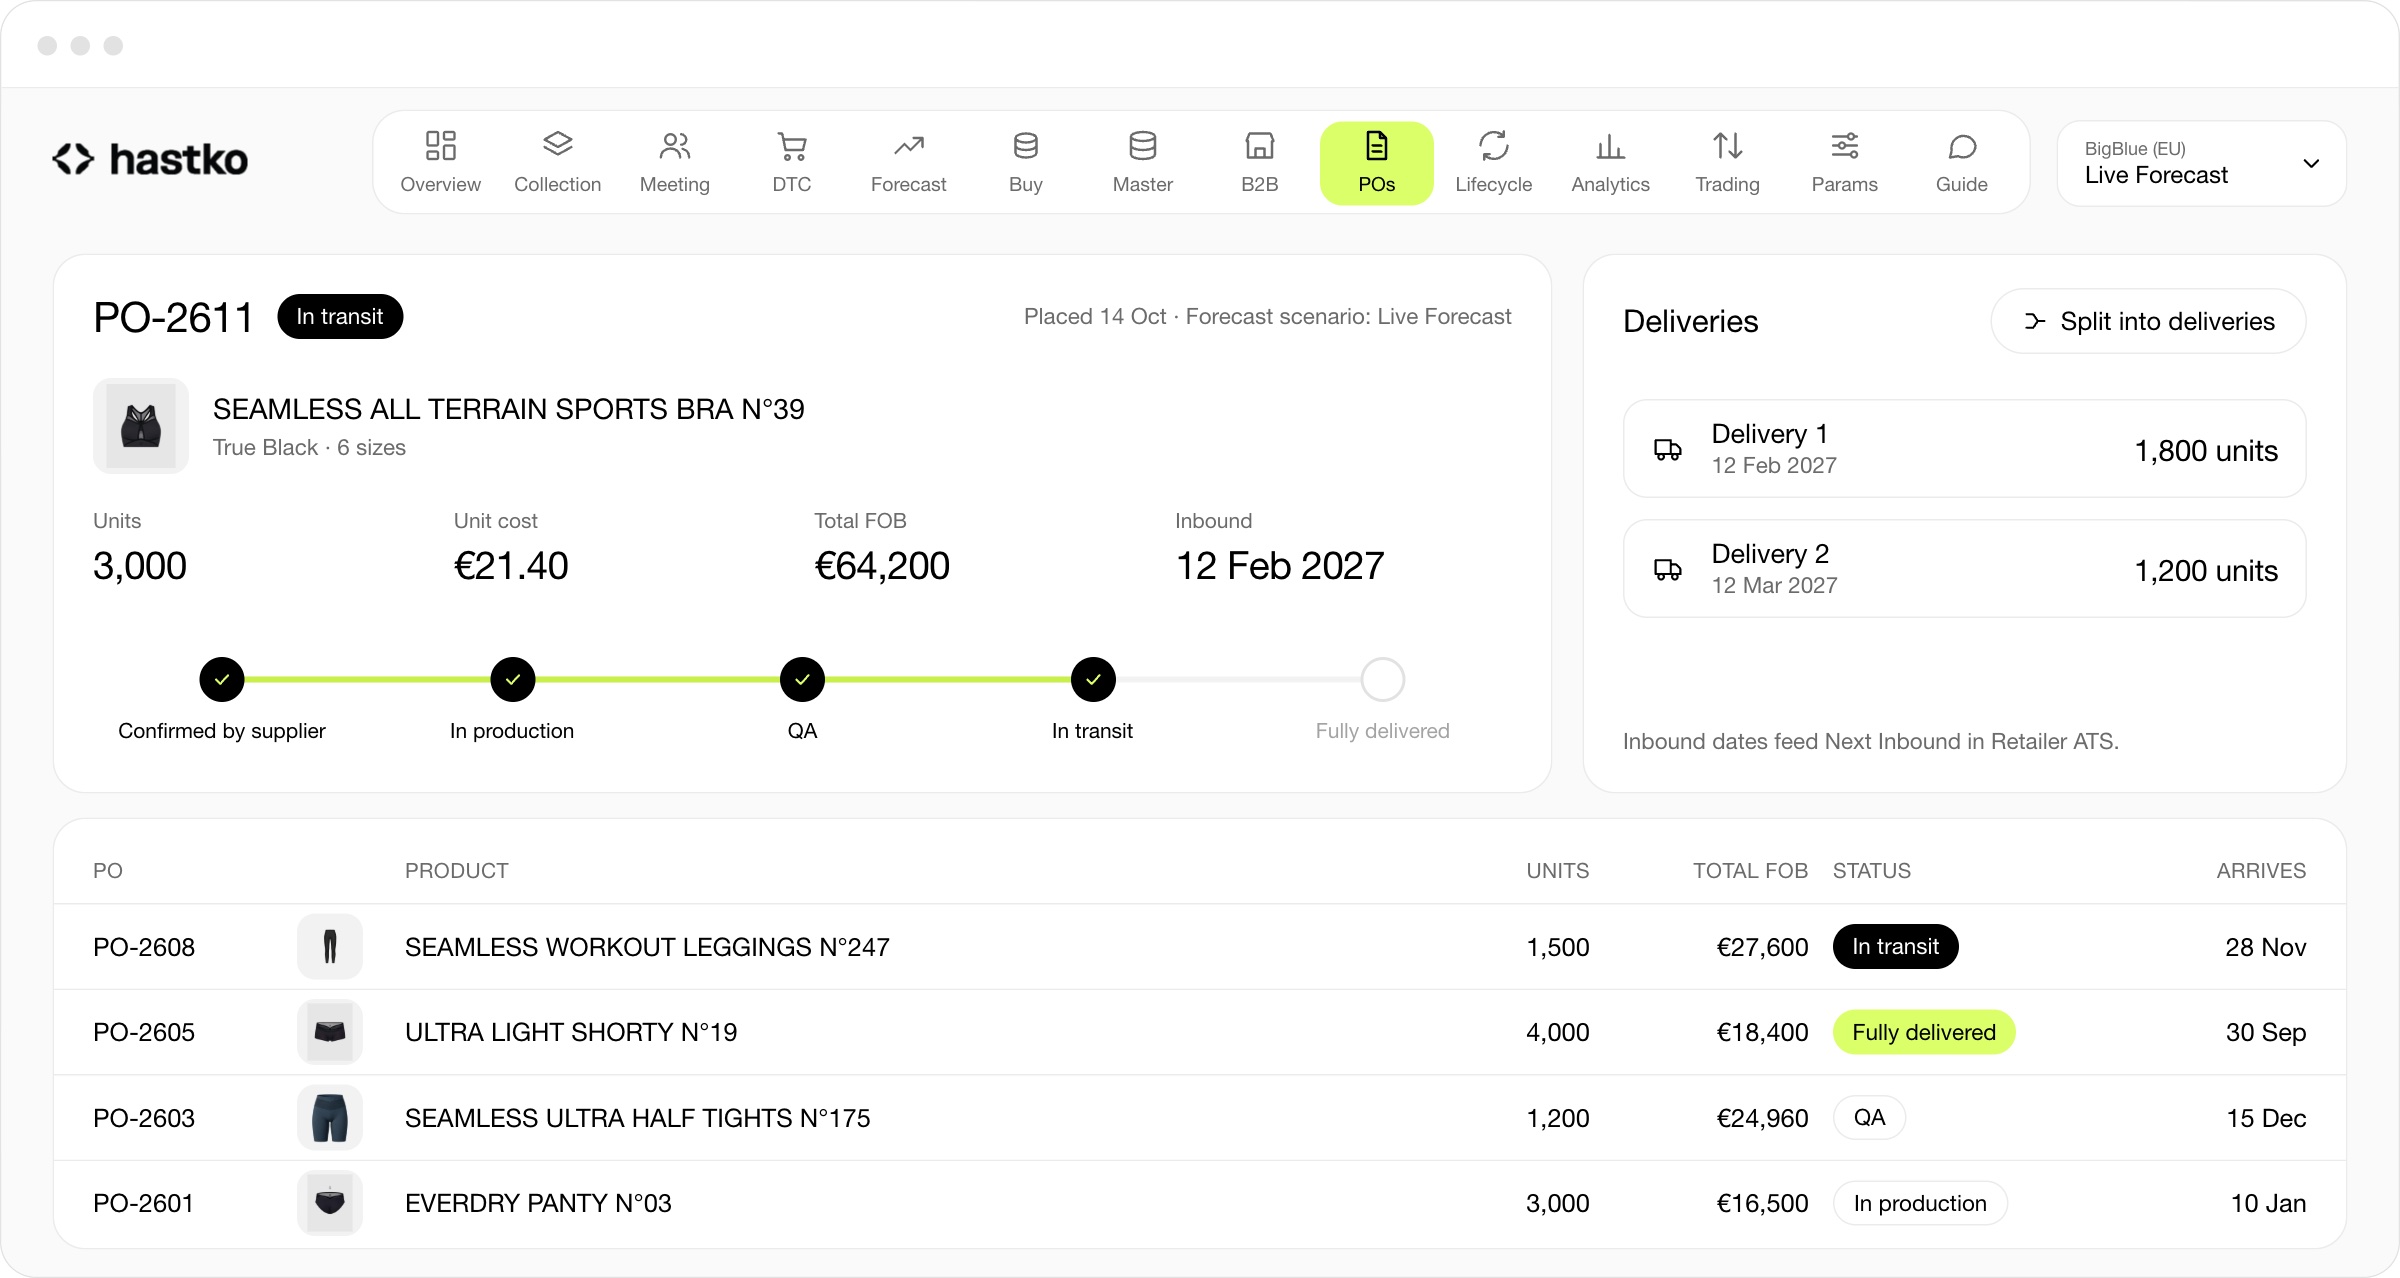
*Figures on mockups are dummy data for demo purposes
Exceptions first
Styles off target, run-out risks, late buys and data problems, each with a four-week trend.
Collection planning
Season targets by category, product and colour, with recommendations to approve.
Forecast and buy
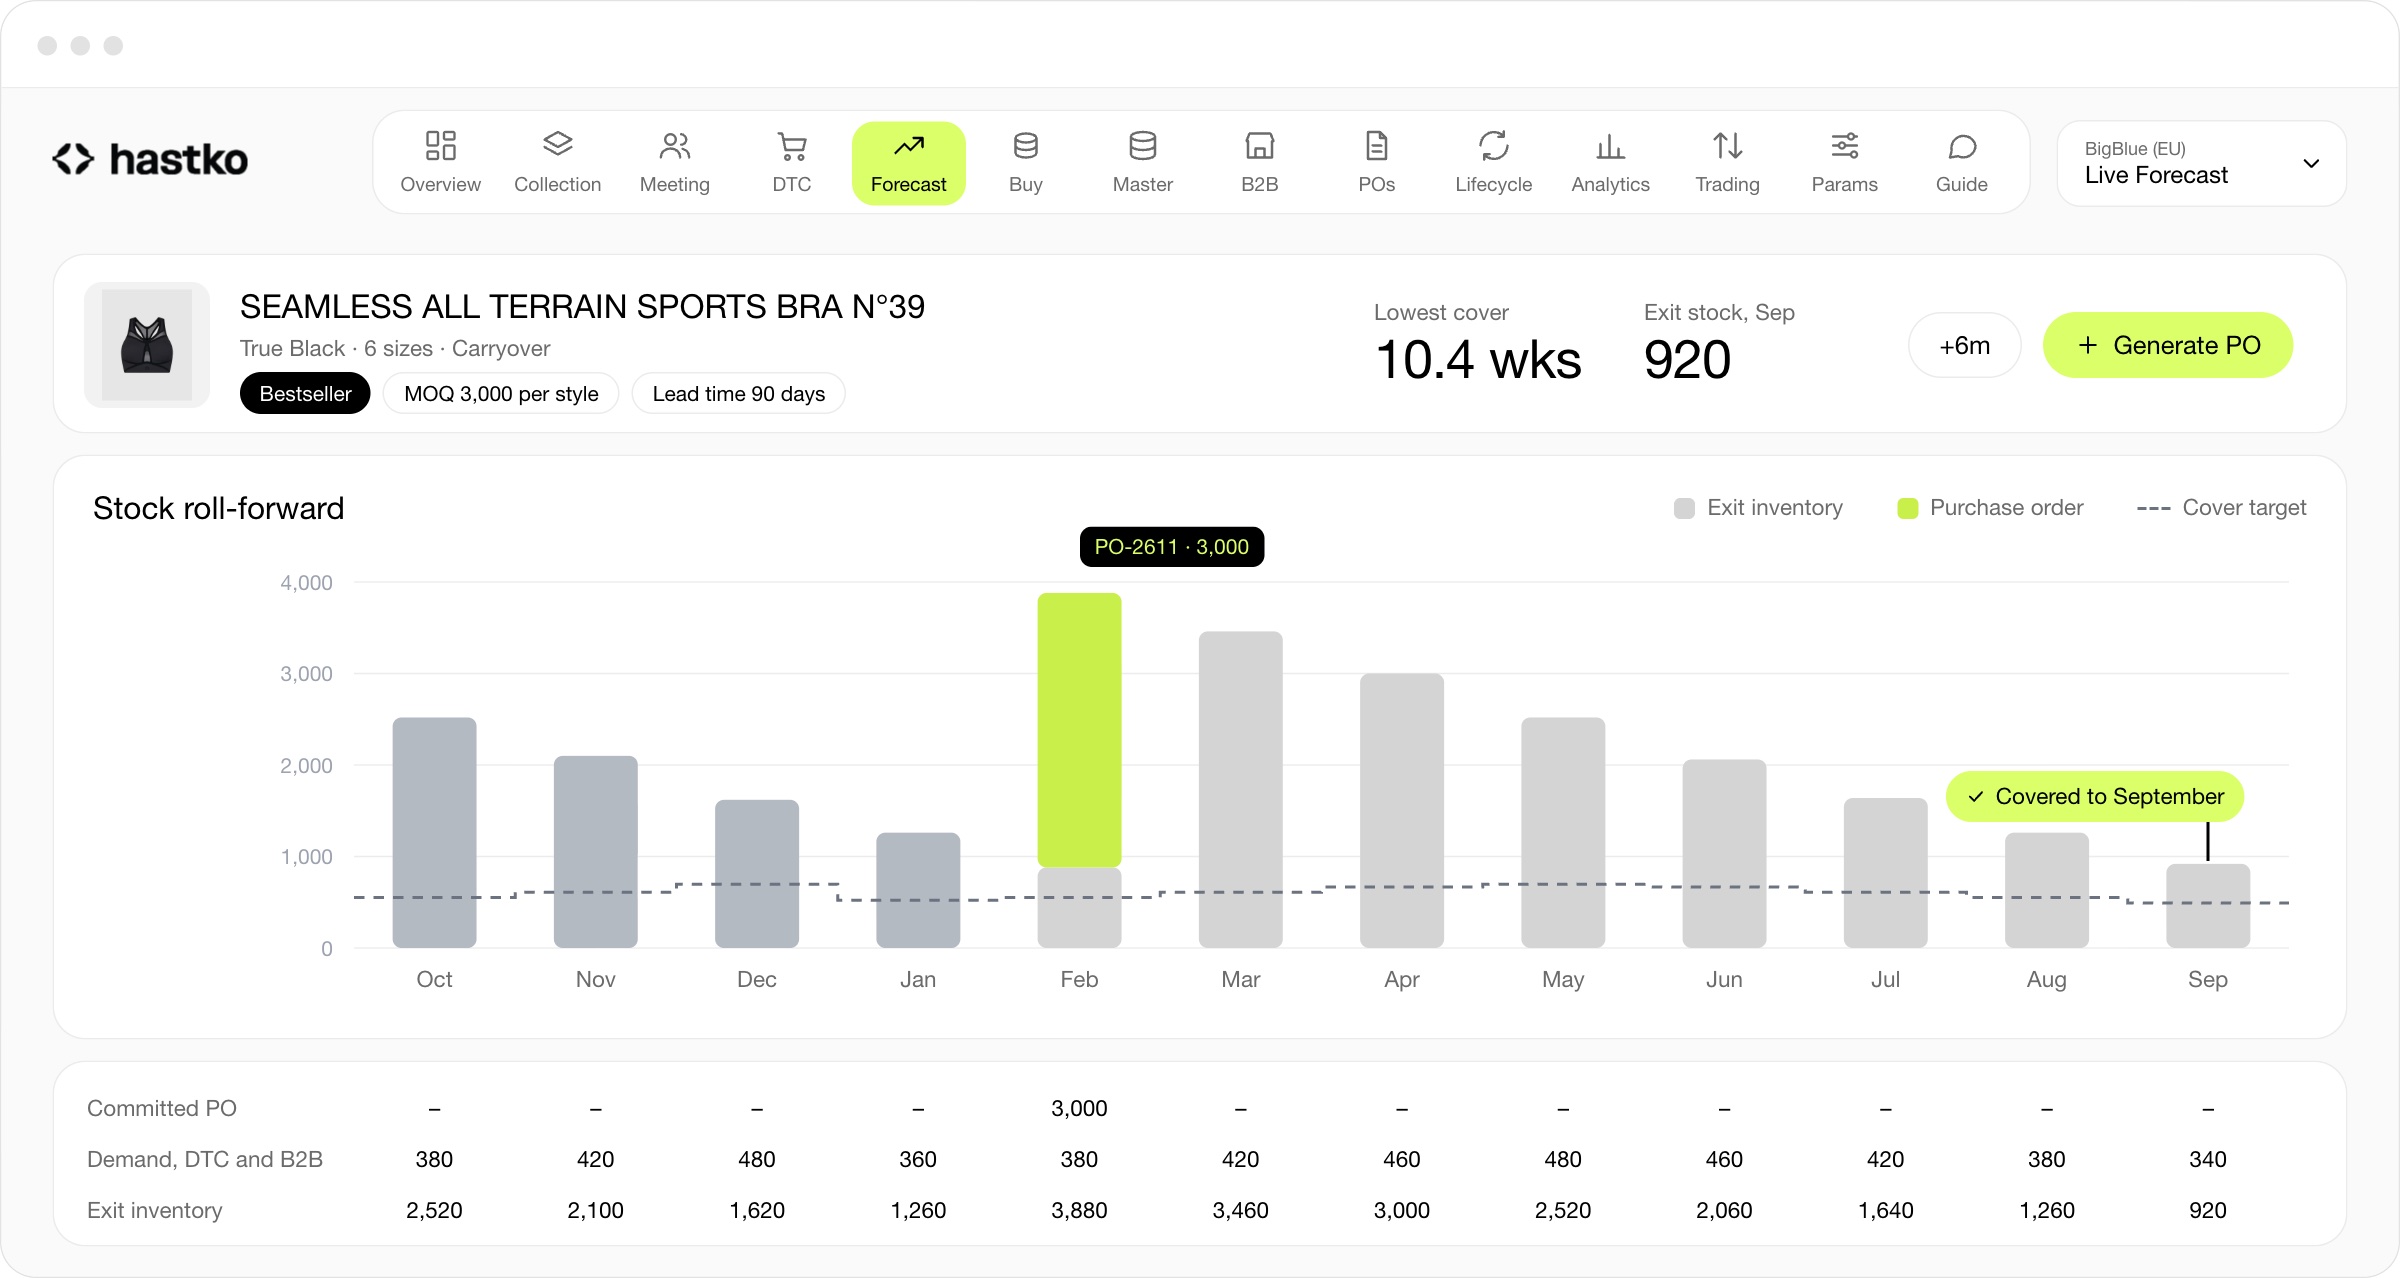
A stock roll-forward per SKU. Generate PO respects minimum orders, lead times and cover targets.
Purchase orders
Production status from supplier confirmation to delivery, split deliveries and inbound dates shared with partners.
Scenarios
Branch a plan for each warehouse, such as the US launch, without touching the live forecast.
Weekly meeting
Pacing, projected month end and stock risk on one page, with an AI summary on each chart.
Analytics
*Figures on mockups are dummy data for demo purposes
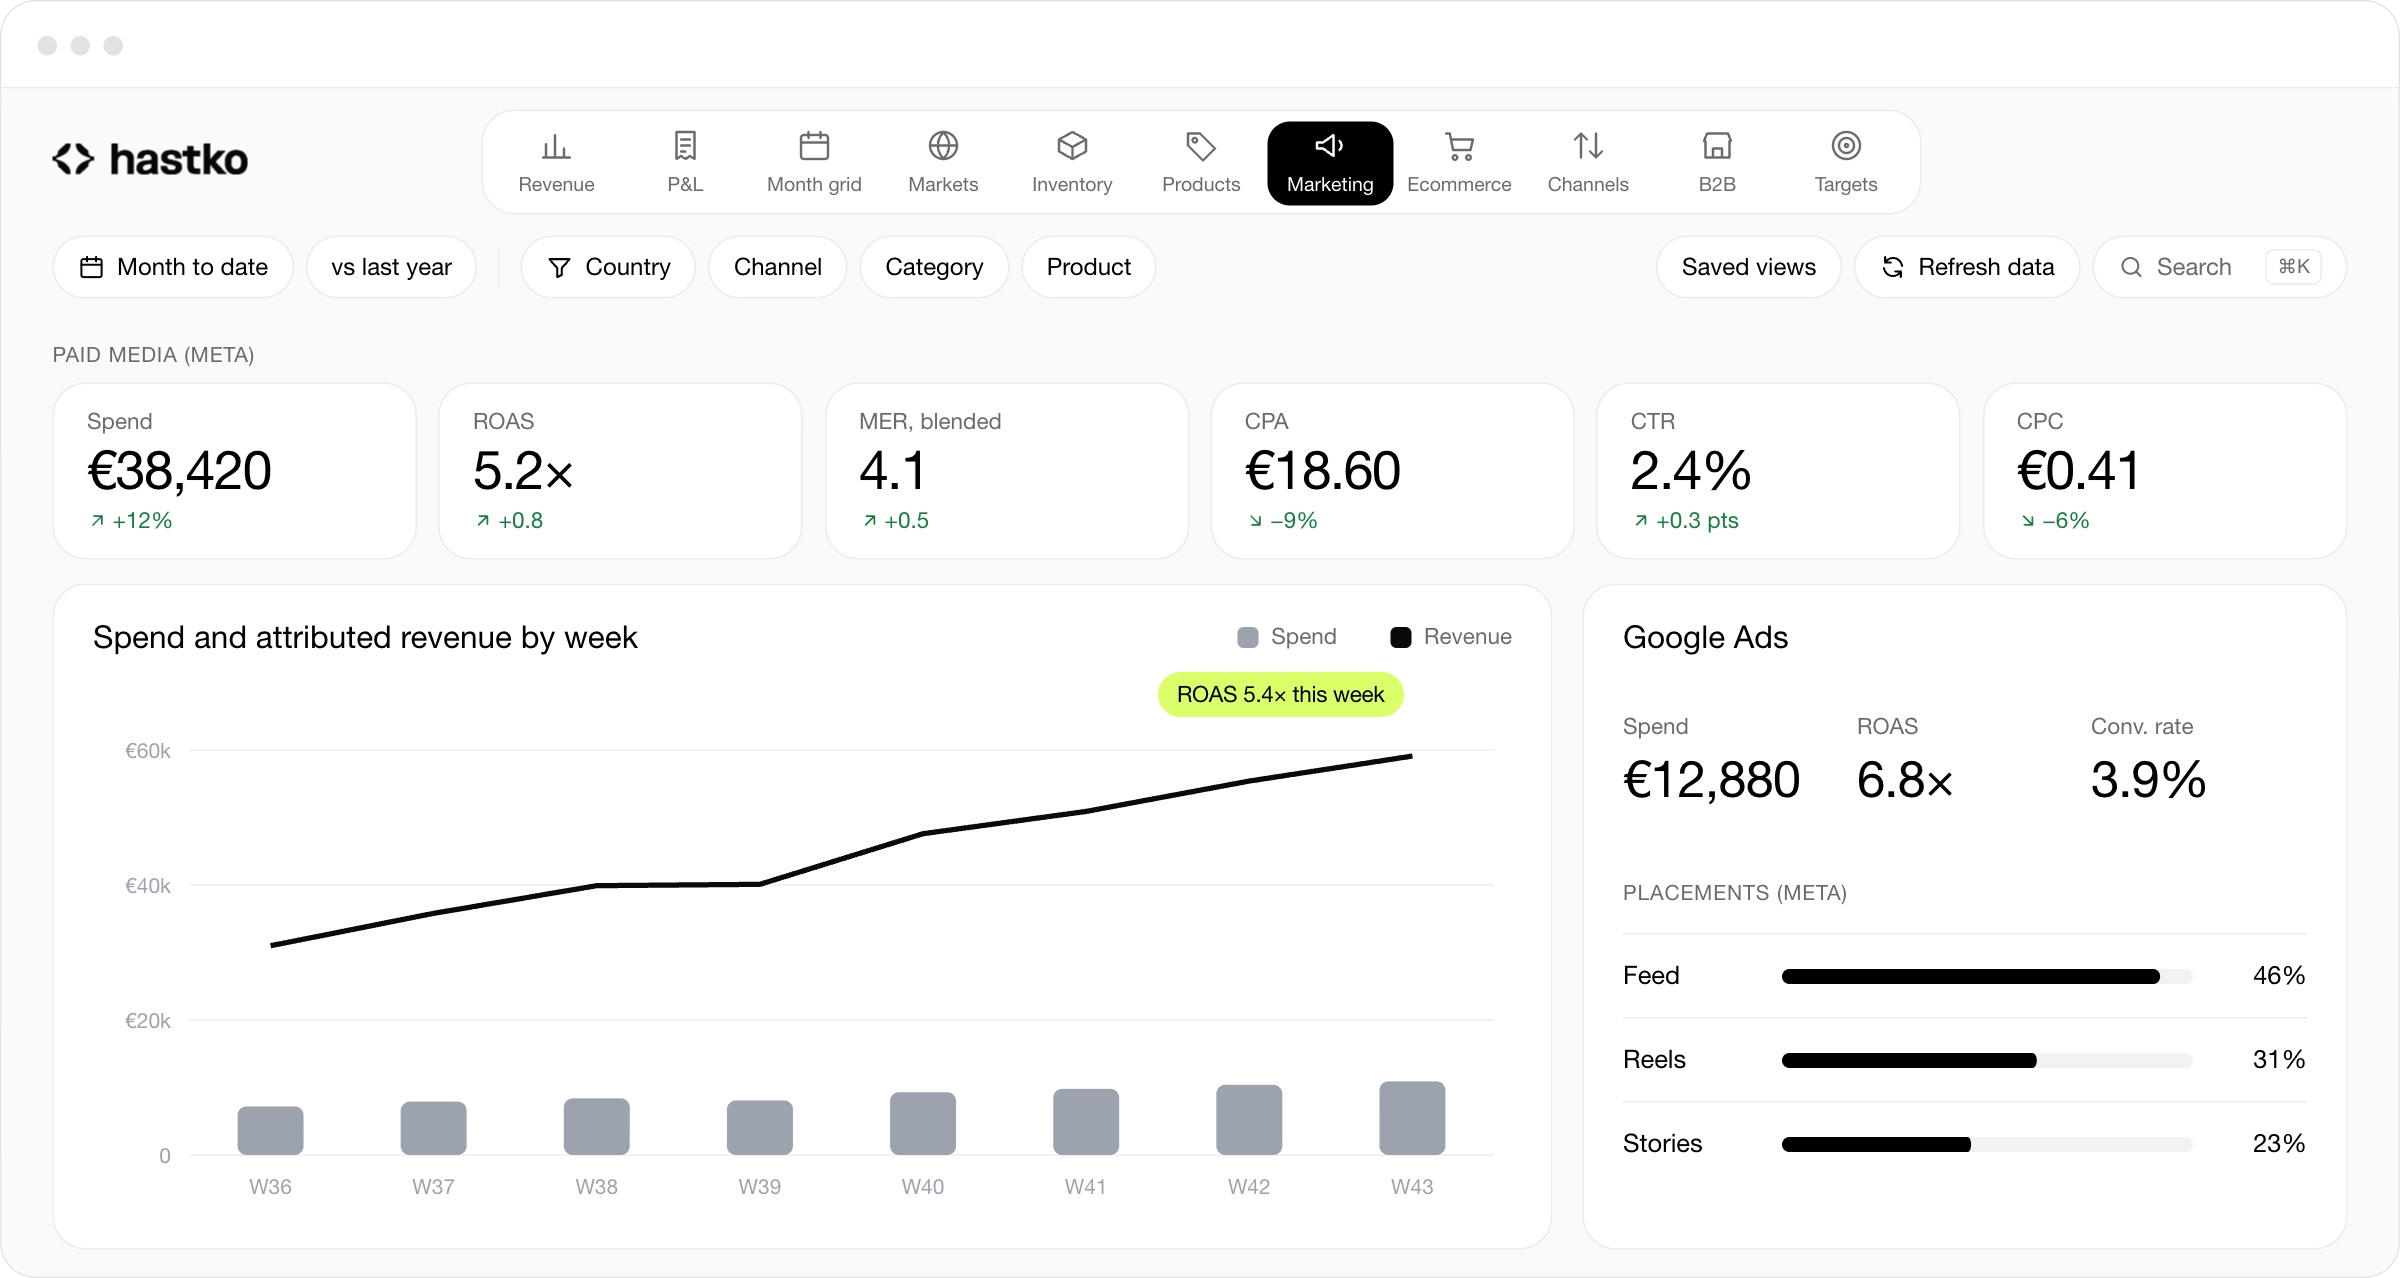
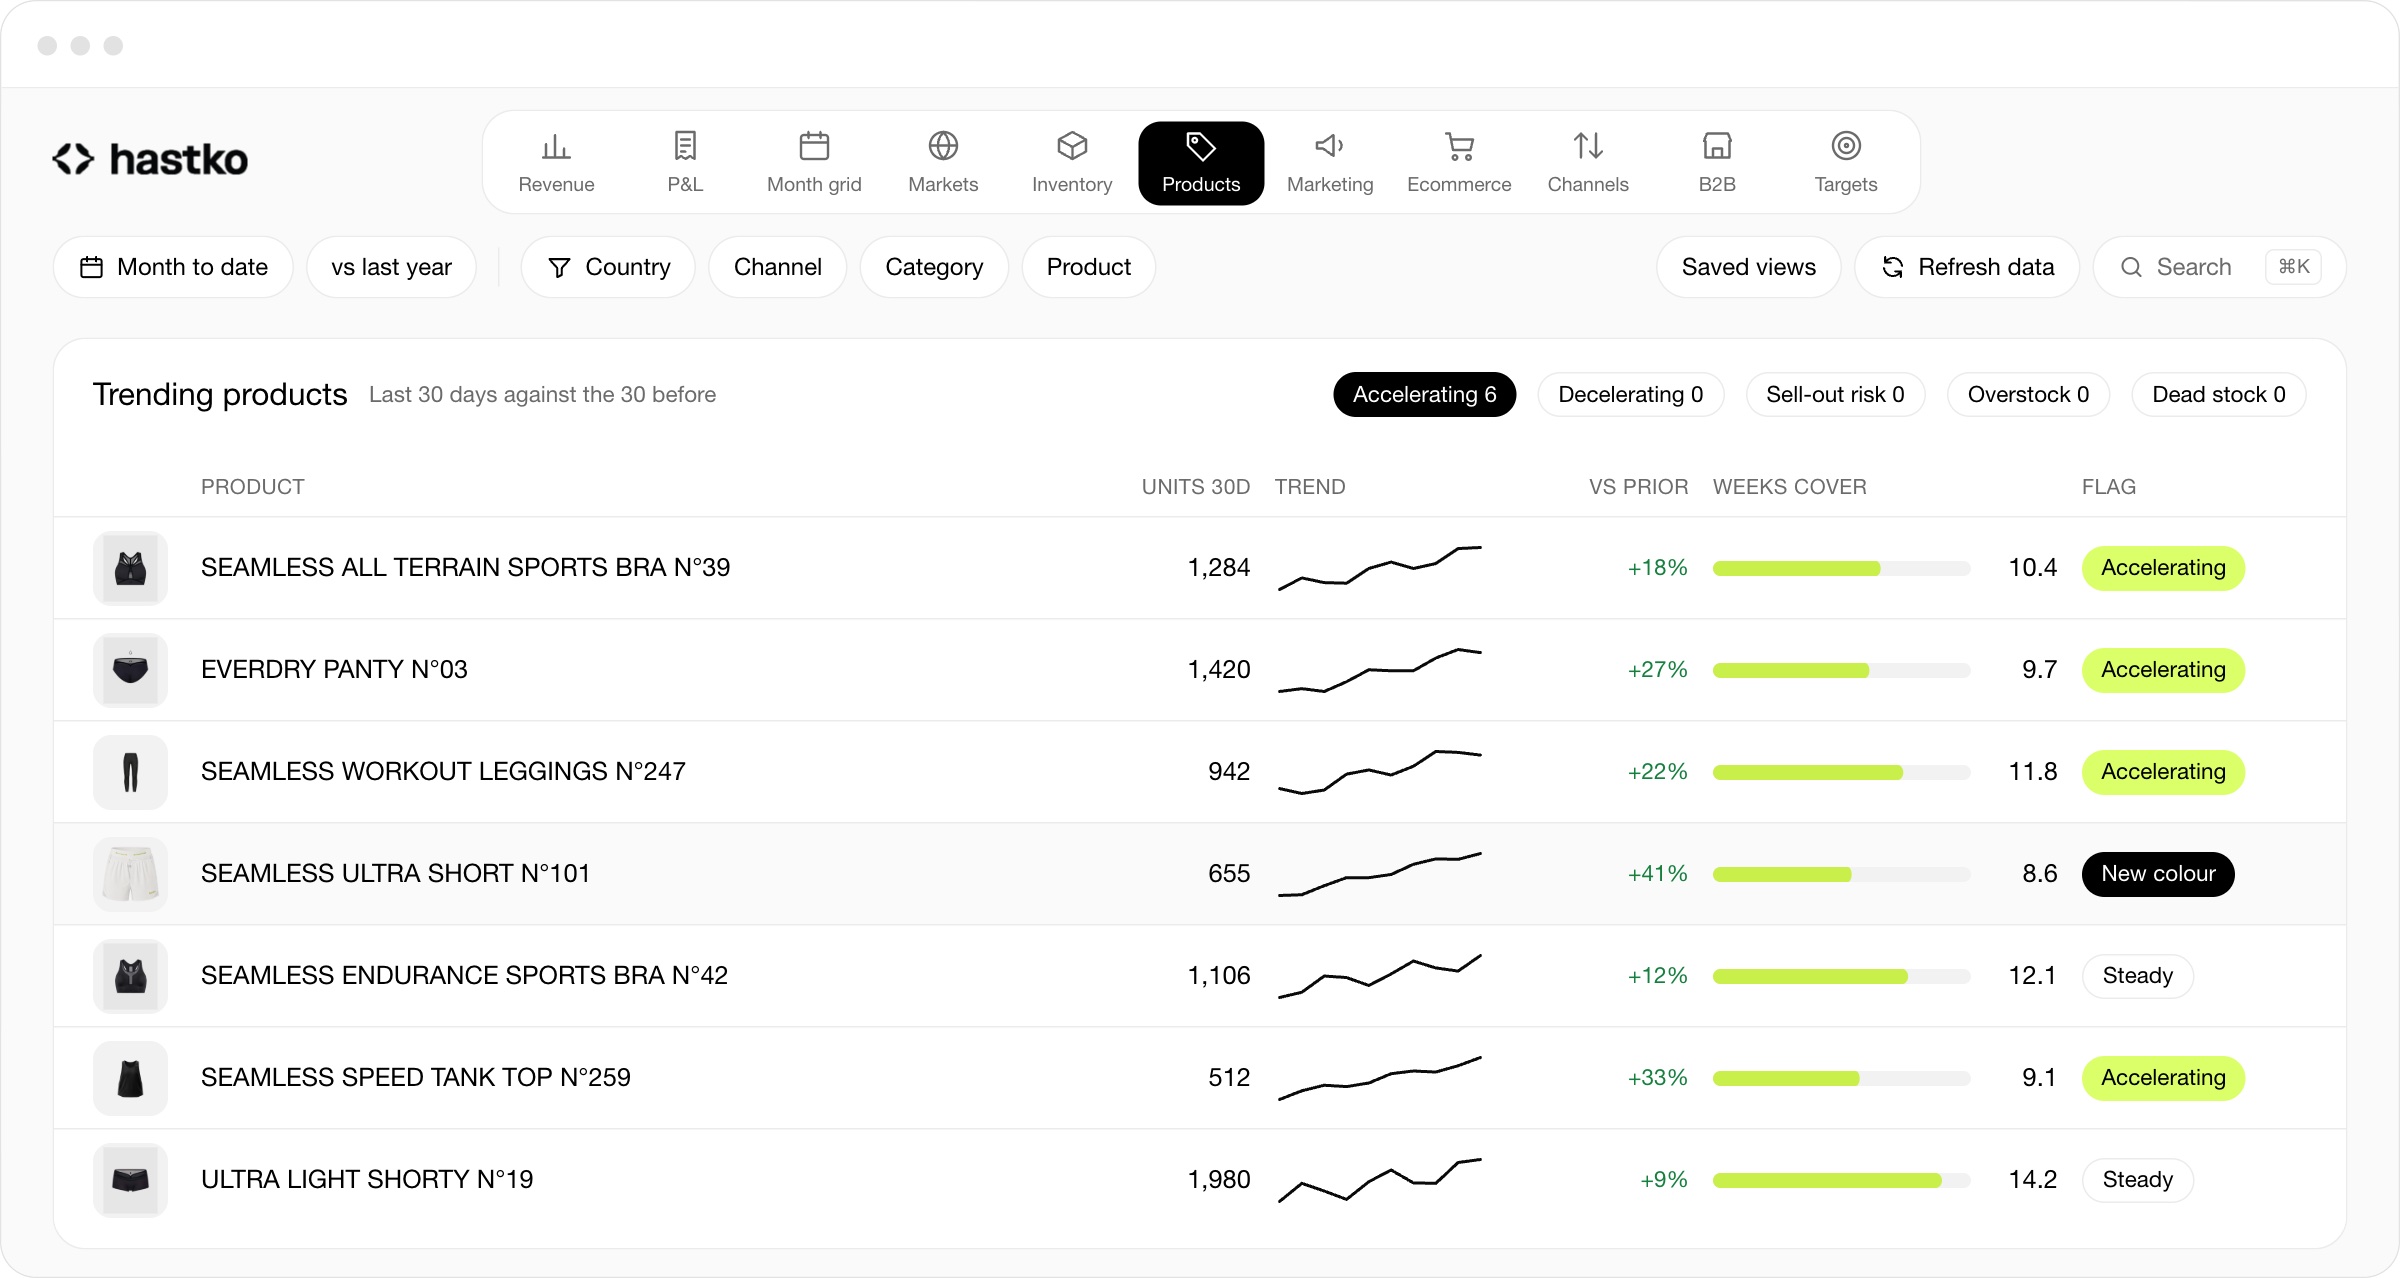
*Figures on mockups are dummy data for demo purposes
Revenue
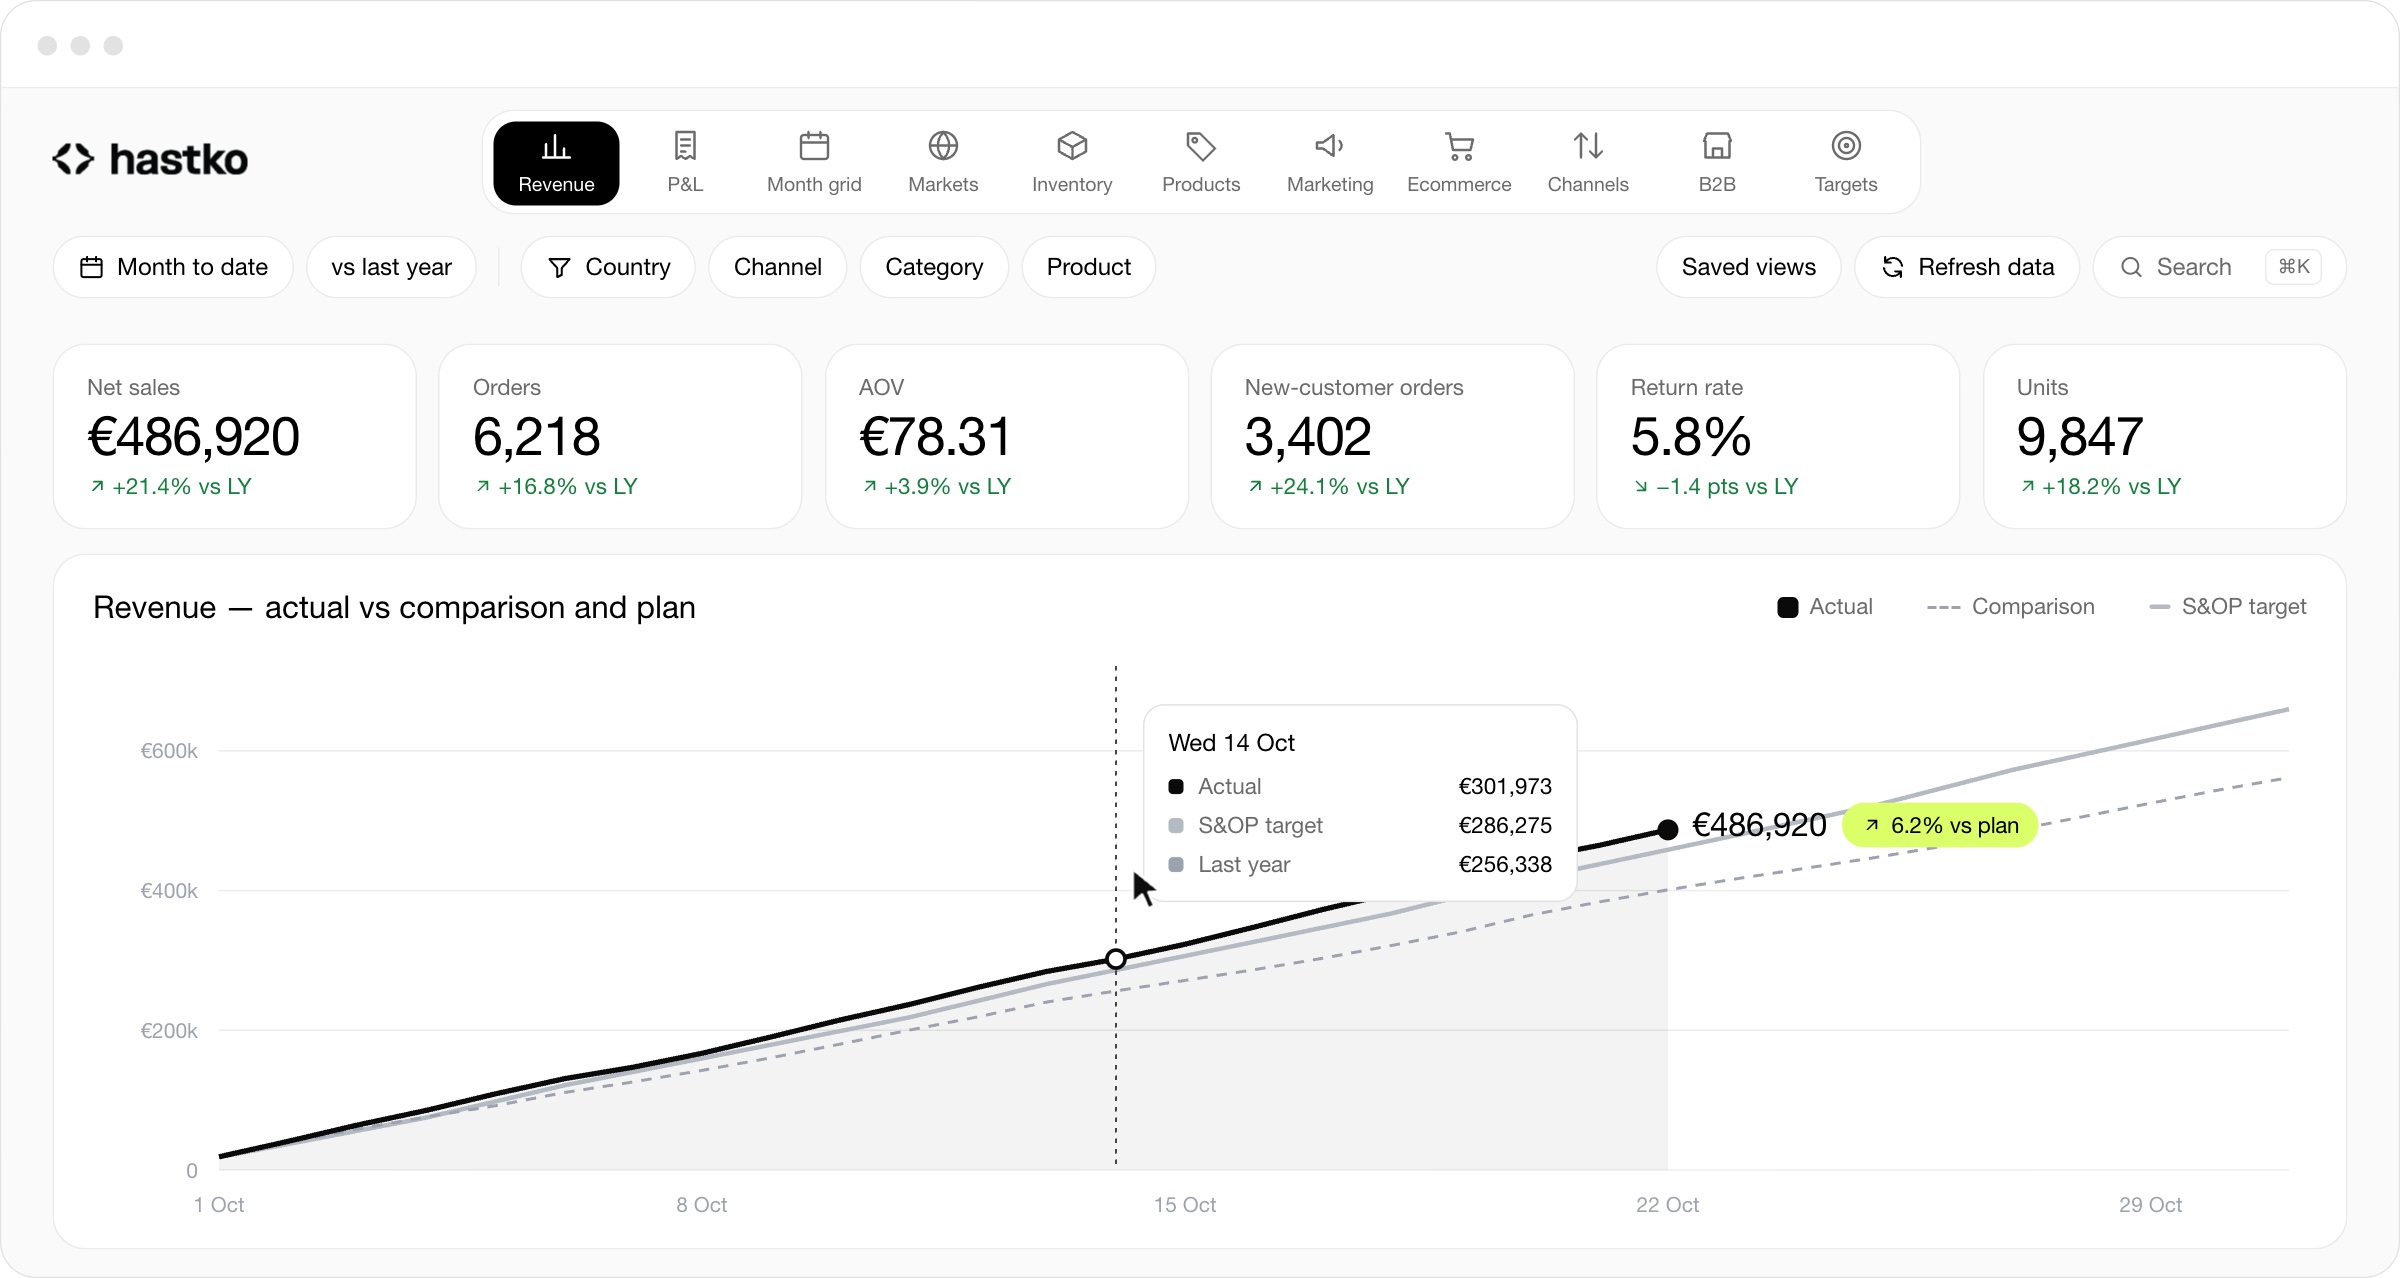
Net sales, orders, AOV, new and returning customers against last year and the S&OP target.
Profit and loss
DTC P&L by day, week or month against the finance team's budget.
Paid media
Meta and Google Ads spend, ROAS, MER and CPA, linked to the products they sell.
Products
A trending board that flags what is accelerating, slowing, at risk of selling out or overstocked.
Markets and channels
Top markets, traffic sources, attribution by channel and repeat purchase by first-order month.
Find anything
Jump to any page, metric, country or product from the command bar.
Eight sources, one source of truth.
We connected all of Hastko's systems. Their data goes into one data warehouse. It updates through the day. The three apps read from it. A number means the same thing everywhere.
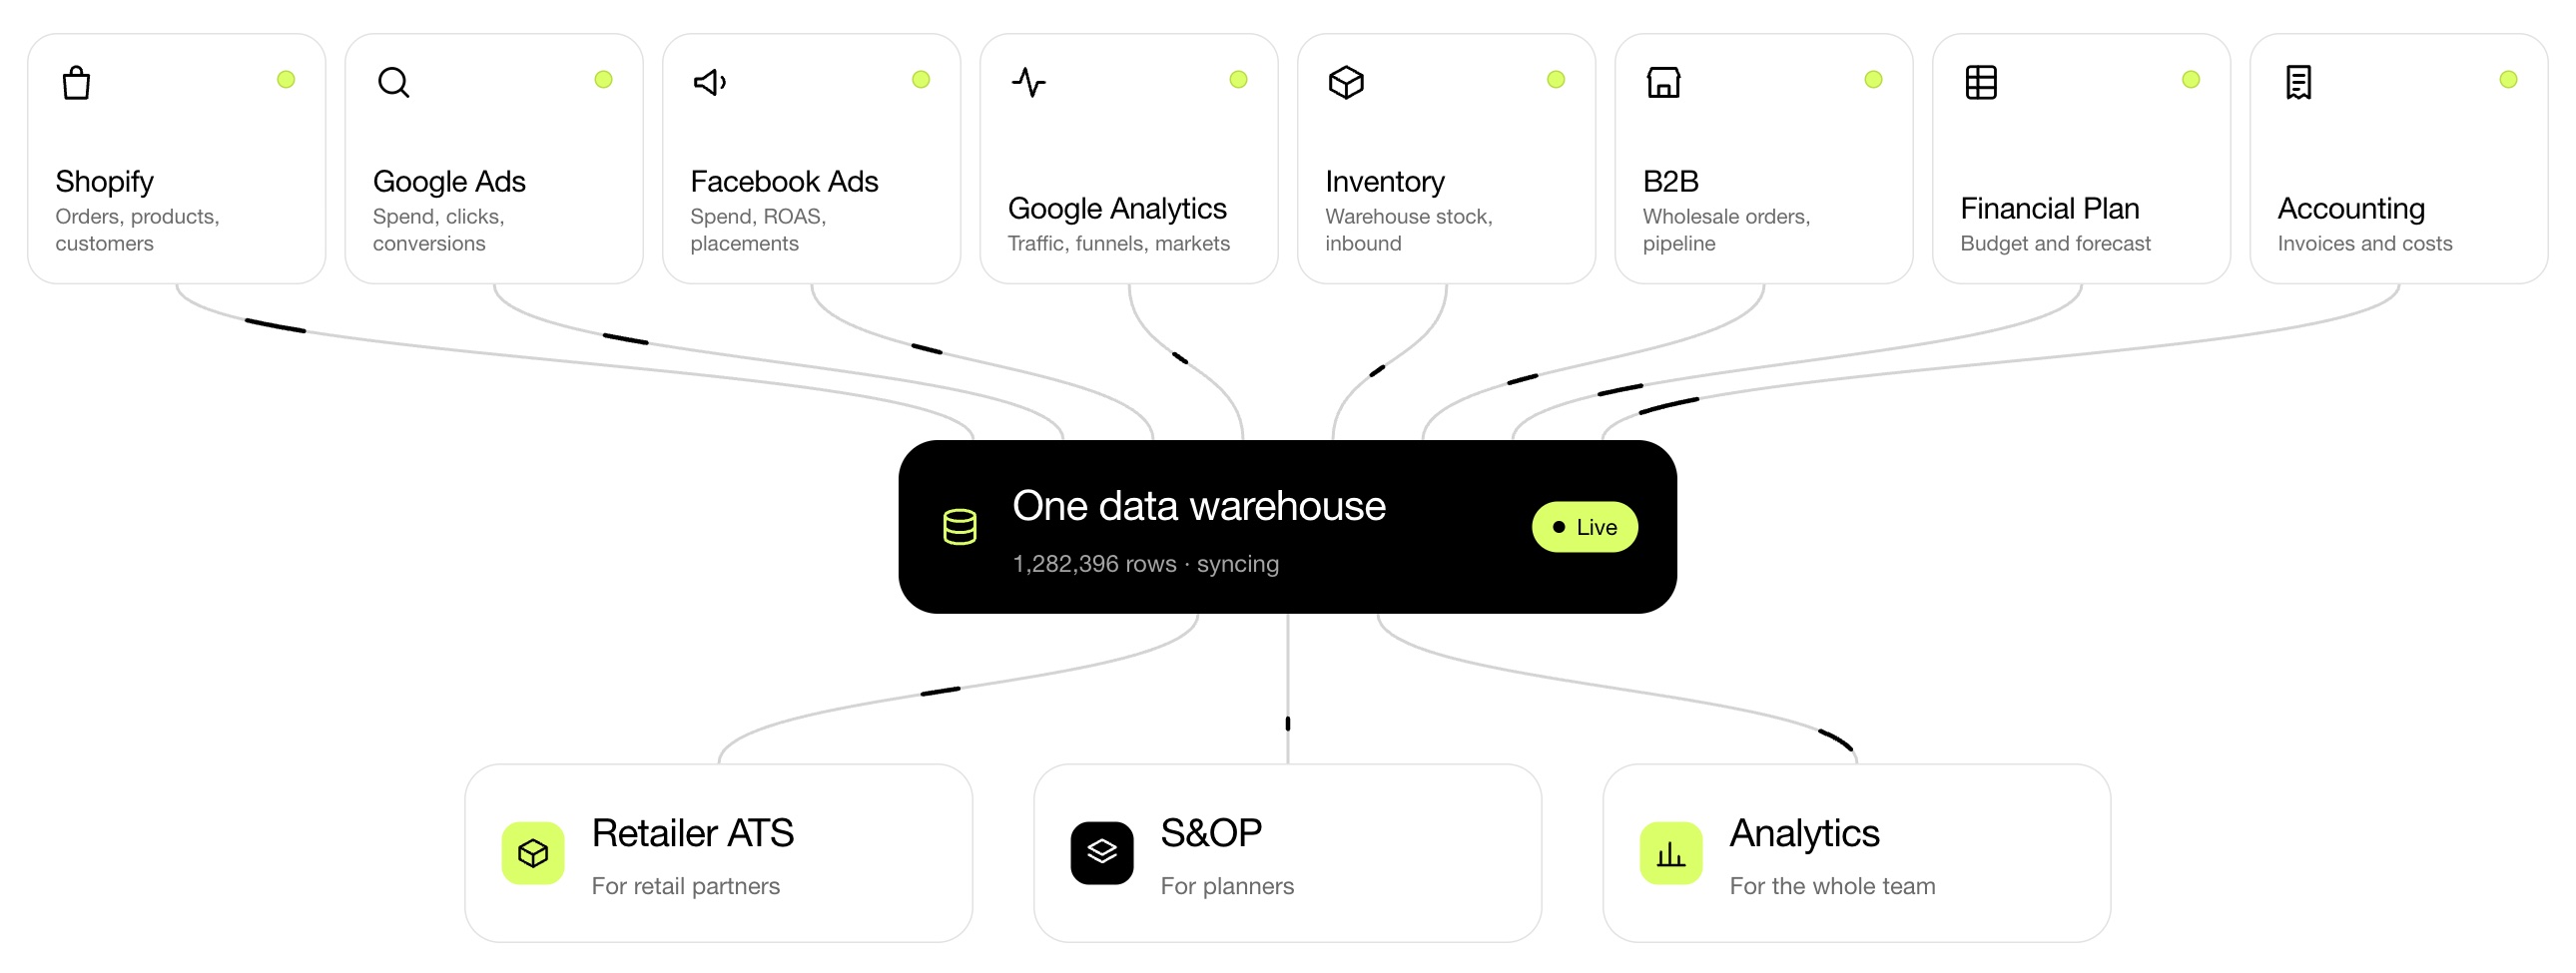
*Figures on mockups are dummy data for demo purposes
Shopify
Orders, products, variants, customers, refunds and abandoned checkouts.
Feeds all three appsGoogle Ads
Spend, clicks and conversions, and paid search in channel reports.
Feeds AnalyticsFacebook Ads
Spend, ROAS and placements, by campaign, country and product.
Feeds AnalyticsGoogle Analytics
Traffic, sources, markets and the conversion funnel.
Feeds AnalyticsInventory
Stock by location from the warehouse, with incoming and reserved units.
Feeds Retailer ATS and S&OPB2B
Wholesale orders, the draft order pipeline and the order book.
Feeds S&OP and AnalyticsFinancial Plan
The budget and forecast workbook from the finance team.
Feeds Analytics P&LAccounting
Invoices and costs, so margins use the real numbers.
Feeds Analytics P&LEvery figure is defined once and written down. A dash in the apps means there is no data, never a zero.
AI where the work happens.
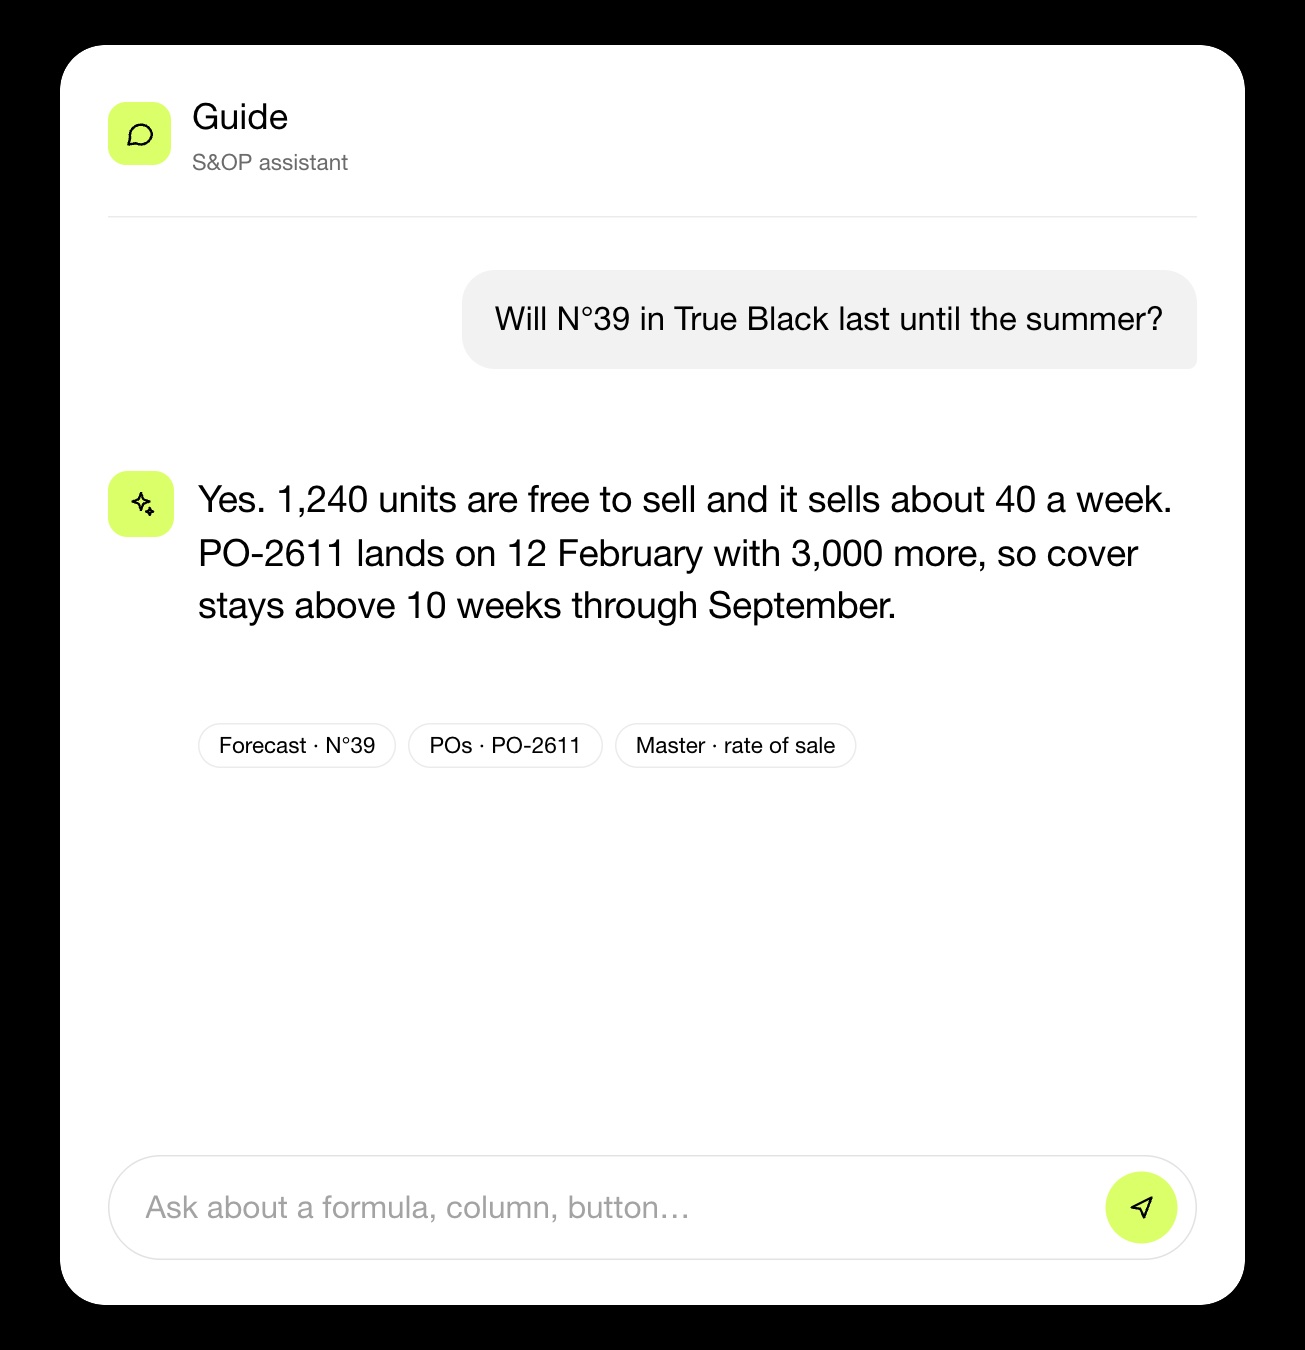
The S&OP Guide answers questions about any formula, column or figure in the apps. Planners ask in plain words and get an answer with its sources.
- An AI summary on each chart of the weekly meeting
- A briefing on any product for the planner who opens it
- Answers that cite the forecast, the PO book and the catalogue